



Feature engineering can be used to transform the messy raw data into the relatively few clean and useful inputs a machine learning model can learn from. Data scientists select, create, and modify these input variables, so every column the model sees carries real predictive power.
It's like preparing before you cook, and no one puts an unclean potato in a pan and expects fries. It's a cliché, but the features you choose are far more important than almost anything else in a project, as Pedro Domingos reemphasized back in 2012.
What is feature engineering in actual practice and how can it be done without falling into a "columns of nowhere" pitfall? We'll answer that with a small house price example, the key techniques, the working tools which people rely on in Python and the pitfalls to avoid.
Key Takeaways
- Feature engineering reshapes raw data so a model can actually see the patterns in it.
- A feature is an input, and the label is the answer the model is trying to guess.
- Most of the work is filling gaps, turning words into numbers, scaling, and building smarter columns.
- Selection keeps some original columns, while extraction squeezes many columns into a few new ones.
- Fit cleanup steps on training data only, then apply them to test data, or your scores will lie to you.
What Is Feature Engineering in Machine Learning?
In machine learning, feature engineering refers to data preprocessing that creates columns or features that a machine learning model can learn from, and make it easier to see patterns.
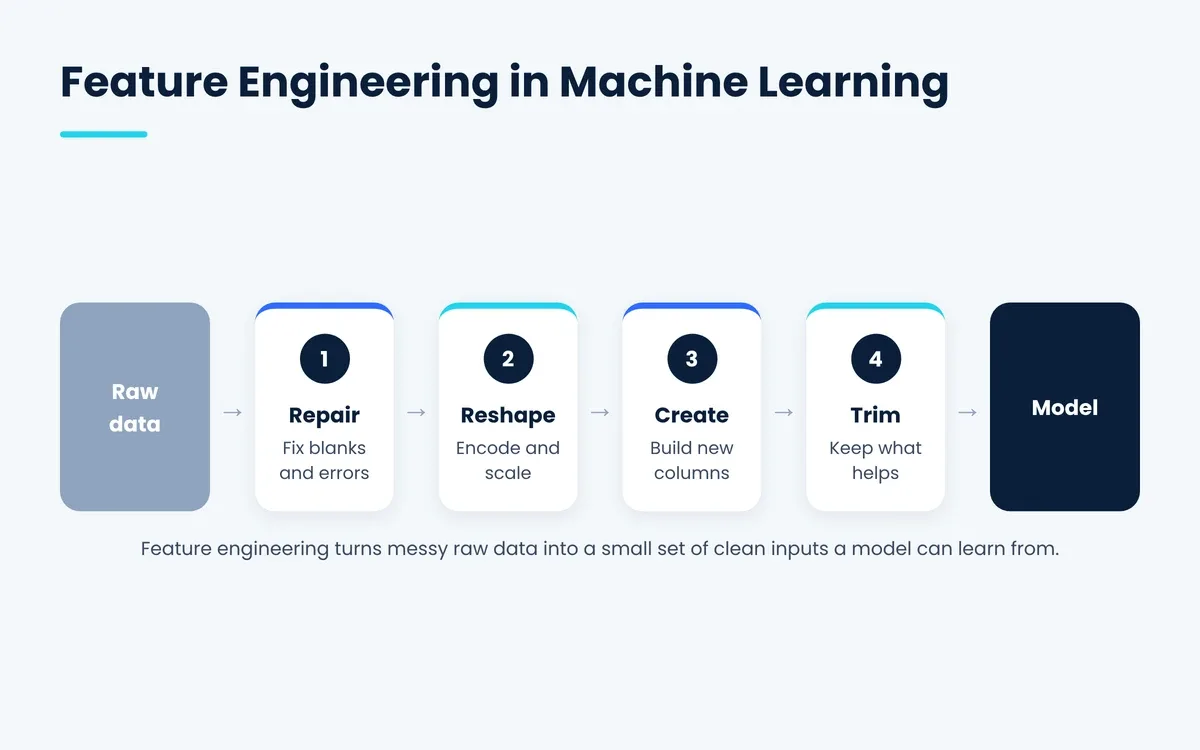
Raw data is rarely ready to use, as fields are often empty or duplicated and dates are contained in text strings. With a little field knowledge, a bit of mathematics, and a few lines of code, that's covered by feature engineering in data science.
You will also see it referred to as featurization, particularly if the raw material is text, pictures, or click logs from an app. The procedure is somewhat the same, regardless of what they're called: repair what needs repair, reshape what is there, create new columns and then, cut the fat.
All of these are part of the larger picture of machine learning: beginning with raw data and culminating with a model that can solve real-world problems by answering questions.
What is a Feature in Machine Learning?
In a machine learning model, a feature is one of the inputs used to make a guess, for example, the size of a house or the age of its roof.
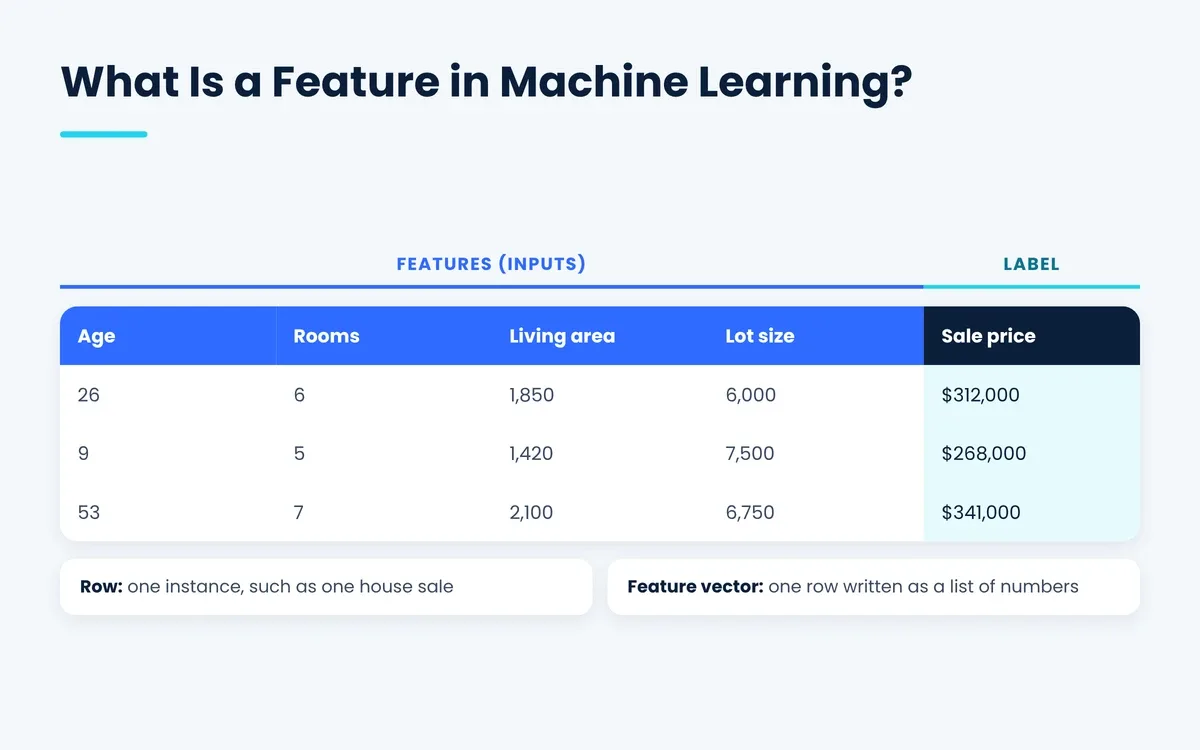
Machine learning features typically are in the form of columns, one for each feature, in a table, with each row representing one instance, in this case one house that sold last spring.
Feature vs Label
The label (some people call it the target variable) is what you want predicted, e.g., the price that a buyer paid for a house. Features tell you what you knew prior to that moment, so a feature should never reveal facts that only come to light after the transaction, since the model won't have them at prediction time.
Feature Vector and Feature Space
A feature vector is one row written as a list of numbers, like [26, 6, 1850, 6000, 0, 1, 0] for the first home below. Then, stack all possible vectors together and you have the feature space, with each new column you add extending the space one more dimension.
The problem Domingos is warning about is the following: the more columns you add on, the harder it becomes to find the right pattern, which is known as the curse of dimensionality.
Why Is Feature Engineering Important?
Feature engineering is important because a more focused input is likely to outperform a more complicated model, and anything that wasn't observed in the data will never be learned by an algorithm.
Suppose you're creating a fraud model, and all you get is the raw time of each purchase, which on its own tells you almost nothing. In a couple of minutes, add one column that counts how many times the card has been swiped over the last hour, and these odd little bursts stick out like a sore thumb.
Good features also make training quicker, reduce the risk of overfitting and give you a clear answer when your boss asks, "Why did the model say no?"
How to Do Feature Engineering Step by Step
Feature engineering is an iterative process that you will repeat numerous times: set the goal, clean up, reshape, add new columns, keep the best ones, test.
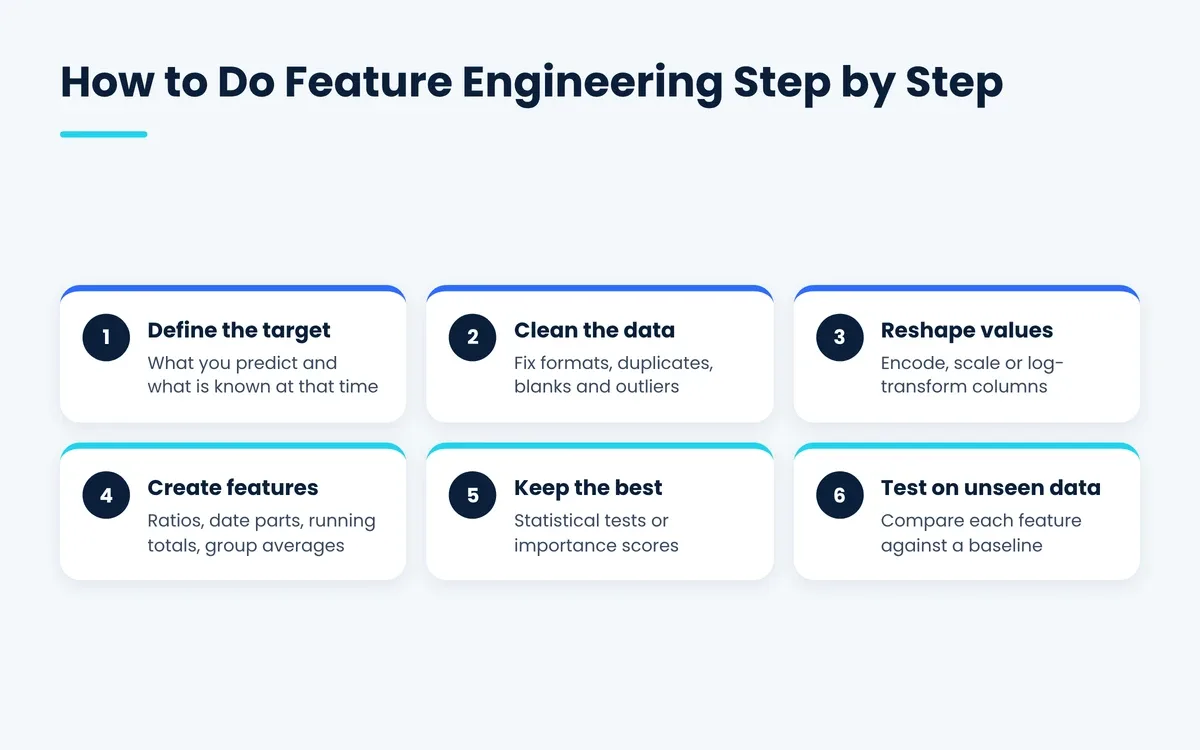
- State the objective by identifying what you are predicting, and make a list of facts you would have at that time.
- Clean the data by fixing broken formats, deleting duplicate rows, and deciding what to do with blanks or odd outliers.
- Reshape the columns and use encoding, scaling or a log transform on the values, to ensure all the values are fed as a number to the model.
- Create new attributes that a more experienced expert would consider, such as ratios, date parts, running totals, or group averages.
- Retain the best inputs that are going into your model by using quick stats tests, or check feature importance scores, and discard columns that are only noise.
- Test a new feature against a baseline and only use the new feature if it improves performance in cross-validation or on a test set it has not encountered before.
None of this can rescue bad training data, however, because there's no magic formula to create facts that you didn't record.
What Are the Key Feature Engineering Techniques?
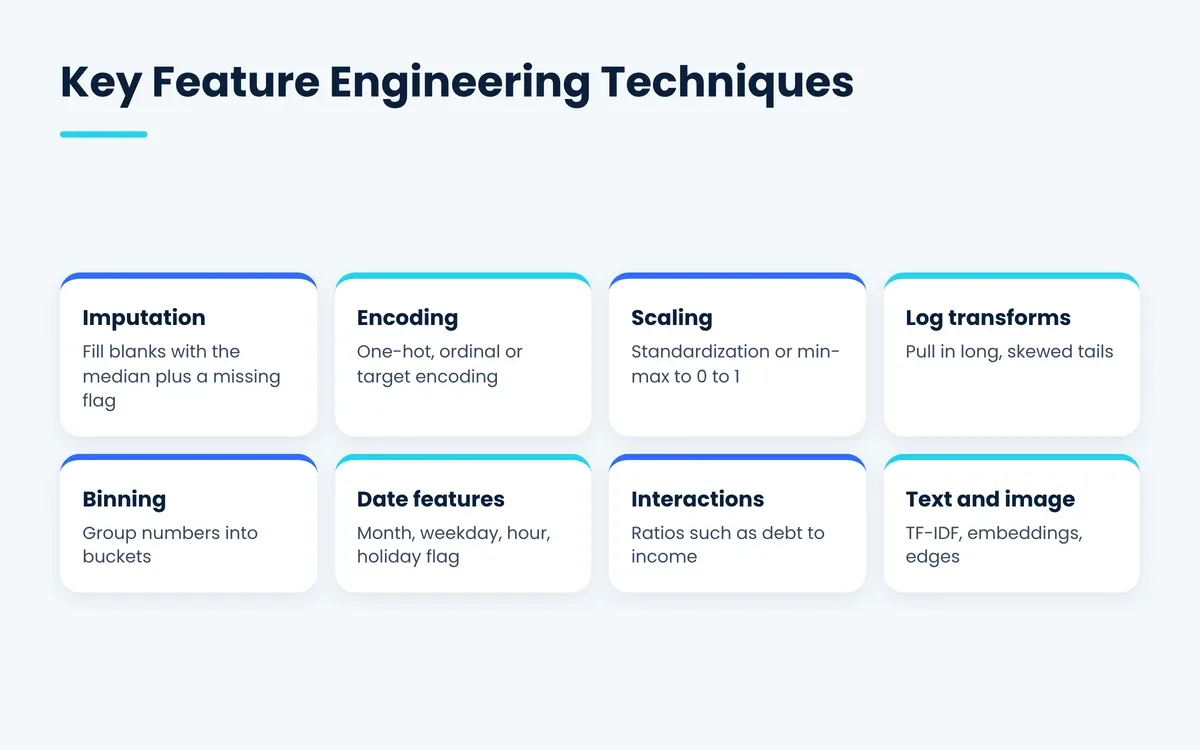
The principal feature engineering techniques include filling gaps, word-to-number, scaling, log math, binning, splitting dates, mixing columns and text work.
Handling Missing Data With Imputation
Imputation fills in a blank with a reasonable guess (usually the median of the column), rather than discarding the entire row. It's a good idea to also include a small yes or no flag for any rows that begin blank, because a loan field left unfilled could be a red flag on its own.
Encoding Categorical Variables
One-hot encoding will create a small column with a 0 or 1 for each neighborhood, preventing the model from creating a false ranking between neighborhoods. Ordinal encoding assigns whole numbers to entities that are truly ordered like small, medium and large coffee cups, while unordered groups are safer with one-hot encoding. The sneaky cousin is target encoding, where each group name is replaced with the average outcome for that group in the training set.
Scaling and Normalization
Standardization adjusts a column to have a mean of 0 and a variance of 1, making vastly different columns comparable. Min-max scaling is the simpler approach, consisting of compressing all the numbers into a nice little box from 0 to 1. But for models that compare distances, such as k-nearest neighbors, the scaling is essential; and random forests simply don't care.
The scikit-learn preprocessing guide will guide you through both scalers and gap fillers that can be inserted into your model code.
Feature Transformation: Log Transforms & Binning
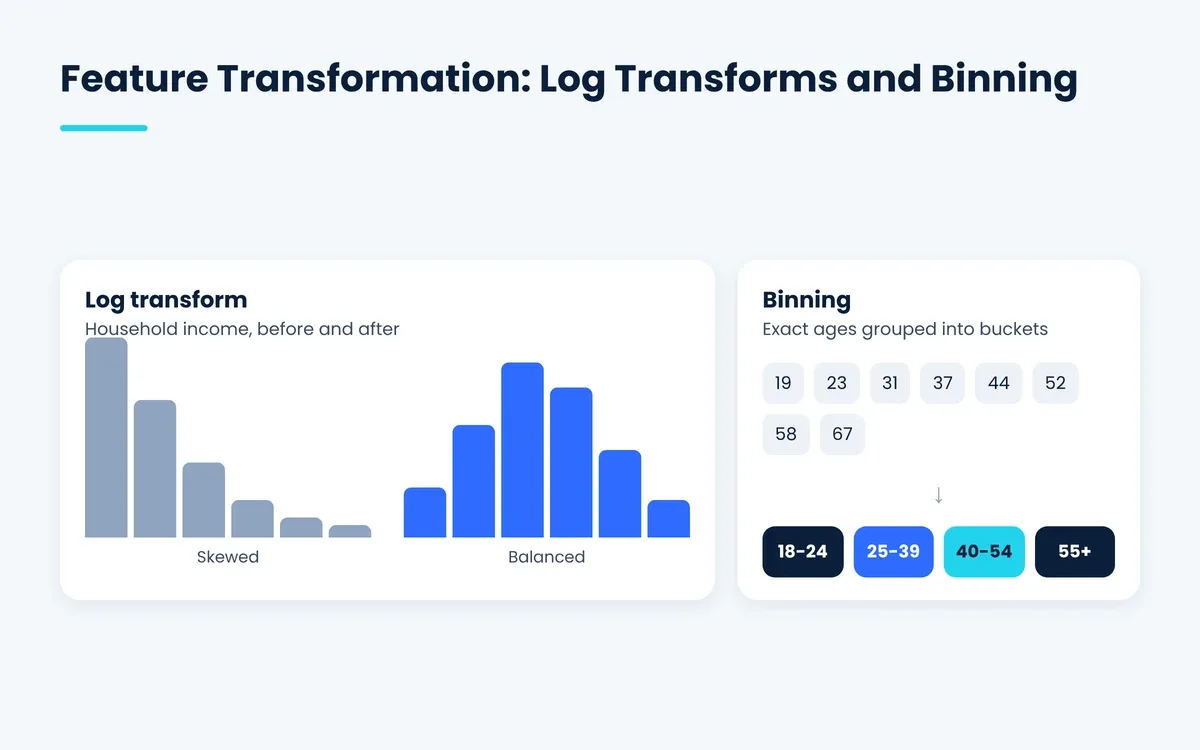
Feature transformation changes the distribution of the values in a column; a log transform is the standard approach to correcting lopsided data such as household income. When the effect of the real thing lands in steps rather than sliding smoothly, it helps to bin the numbers into buckets, e.g., ages 18 to 24.
Date and Time Features
Most models don't care much about a raw timestamp, but the month, weekday, or hour that are buried inside it may be worth gold in their eyes. For a grocery store, for example, it's often best to add a simple weekend flag or holiday flag to their model.
Interaction and Polynomial Features
Interactions are a combination of two columns and the textbook example of a loan risk model is debt/income. Polynomial features take the square or cube of a number, allowing a simple, straight-line model to bend enough to follow a curve.
Text and Image Features
In text featurization, words are converted into numbers, using either raw word count or TF-IDF, or embeddings that group together words with similar meanings. When talking about images, raw pixels are just a few thousand numbers that are of very little use, so the work is edges, color statistics, or embeddings extracted from a pretrained network.
Feature Selection vs Feature Extraction: What’s the Difference?
Feature selection retains a few of your first features as is, and feature extraction combines many of your features into a few new ones.
| Aspect | Feature selection | Feature extraction |
|---|---|---|
| What you get | Some of the original columns | New columns built from the old ones |
| Easy to explain? | Yes, each column keeps its meaning | Less so, each new column mixes several inputs |
| Common methods | Correlation filters, chi-square tests, recursive feature elimination, Lasso | PCA, autoencoders, TF-IDF, embeddings |
| Best for | Explaining results to business teams | Shrinking hundreds of related or raw inputs |
Feature selection vs feature extraction only becomes a real decision once you're looking at hundreds of columns. There are three types of selection and filters are the fastest as they score each column using a quick stats test before any model is run. In wrapper methods, different subsets of columns are tested using an actual model, while in embedded methods the picking is done while the model trains.
Lasso is the embedded example to use; it pushes weak weights all the way down to zero, and removes those columns for you. PCA is the dimensionality reduction workhorse on the extraction side: it folds related columns into a few new ones which retain most of the spread.
If you want working code for any of these, there are brief examples in the scikit-learn feature selection guide that you can copy and paste into a notebook.
What is a Feature Engineering Example?
A simple feature engineering example is raw house sales, where the dates, blanks, and neighborhood names are converted to clean numbers that can be used by a price model.
Below is a small sample data set with a few home sales that include the date of sale, build year, the size of the home, the lot size, the neighborhood, and the price.
| Sale date | Built year | Living area (sq ft) | Lot size (sq ft) | Neighborhood | Sale price |
|---|---|---|---|---|---|
| 2024-06-15 | 1998 | 1,850 | 6,000 | Oak Park | $412,000 |
| 2024-11-02 | 2015 | 2,400 | 7,500 | Riverside | $538,000 |
| 2025-03-20 | 1972 | 1,320 | Missing | Oak Park | $289,000 |
Three glaring issues come immediately to mind: the dates are text, one lot size is not present, and the neighborhood column is rife with words.
| House age | Sale month | Living area | Lot size | Lot missing | Oak Park | Riverside | Sale price (label) |
|---|---|---|---|---|---|---|---|
| 26 | 6 | 1,850 | 6,000 | 0 | 1 | 0 | $412,000 |
| 9 | 11 | 2,400 | 7,500 | 0 | 0 | 1 | $538,000 |
| 53 | 3 | 1,320 | 6,750 | 1 | 1 | 0 | $289,000 |
Age is given to the house by deducting the construction year from the year the home was sold, giving the model a good approximation of wear and tear. That empty lot size is filled by the median of the other two lot sizes, 6,750 square feet, plus a flag to hide nothing.
Then by one-hot encoding, the neighborhood is divided into two columns, allowing the model to learn the price bump for each neighborhood. The pandas code below performs the same operations on a complete home sales data file, splits the rows, and separates the target; you can modify it to suit your data.
You'll notice that the median is only calculated from the training rows because otherwise you would be giving away test answers to the model. Price per square foot is not included either, because it is built from the sale price itself and it would give the model the answer.
import pandas as pd
from sklearn.model_selection import train_test_split
homes = pd.read_csv("home_sales.csv", parse_dates=["sale_date"])
homes["house_age"] = homes["sale_date"].dt.year - homes["built_year"]
homes["sale_month"] = homes["sale_date"].dt.month
homes["lot_missing"] = homes["lot_sqft"].isna().astype(int)
#Split rows first, so the median comes from training data only
train_index, test_index = train_test_split(homes.index, test_size=0.2, random_state=42)
train_median = homes.loc[train_index, "lot_sqft"].median()
homes["lot_sqft"] = homes["lot_sqft"].fillna(train_median)
What Are the Best Tools for Feature Engineering in Python?
The most popular feature engineering tools in Python are pandas, scikit-learn, Featuretools, and Feast; each of which handles a different portion of the job.
- pandas loads, cleans and groups your data; its get_dummies function does one-hot encoding in a single line.
- scikit-learn provides you with scalers, gap fillers and column pickers; and once you have them linked together, any new data you add is treated exactly the same.
- Featuretools makes features across linked tables with Deep Feature Synthesis, so you can eliminate repetitive group-bys and joins.
- Feast is an open source feature store to deliver the same feature values to your training jobs and your live apps.
- NumPy is the speedy layer for number crunching that most of these operate on top of, so a log transform on millions of rows takes seconds.
Should Feature Engineering Be Part of ETL?
Feature engineering is a related task to ETL, but is not the same one: ETL tasks prepare the data for storage; feature engineering tasks prepare the data for one particular model.
The ETL pipeline extracts data from various data sources, transforms it from one data format to another, and finally inserts it into a warehouse for reporting. After that, feature work typically begins and a person begins to extract those tables into a notebook and builds columns for one model.
There will be many teams later who take their battle-tested feature code back through the pipeline, which keeps training and live apps from wandering apart.
What Is Real Time Feature Engineering?
Real time feature engineering creates features in real-time as the app requests a prediction, with new signals, such as the last 5 clicks or swipes.
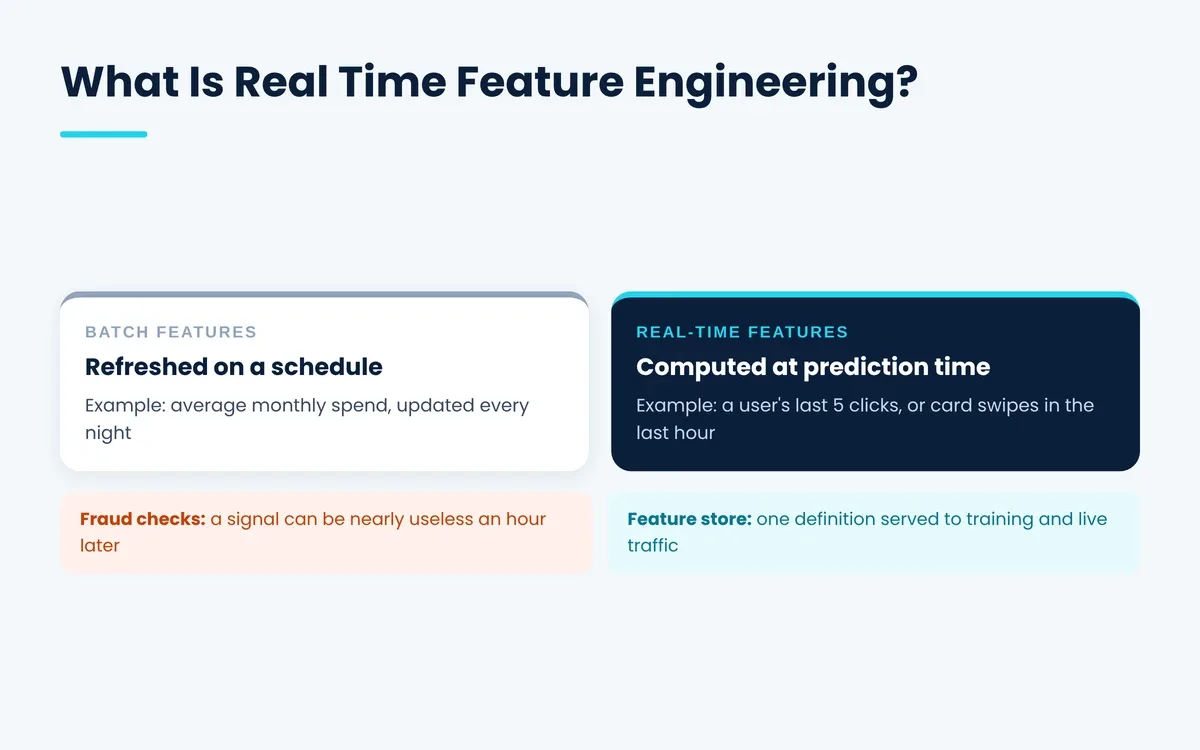
Batch features, such as a shopper's average monthly spend, refresh according to a schedule, typically overnight or on a weekly basis at most. Real-time features follow items that update in seconds and there is a strong need for freshness for fraud checking or surge pricing for ride apps. After about an hour, a fraud signal is practically useless and these models require inputs to be calculated in real-time.
Feature stores eliminate this matching headache by computing each feature once, and providing the same to training and to live traffic.
What Are Common Feature Engineering Mistakes?
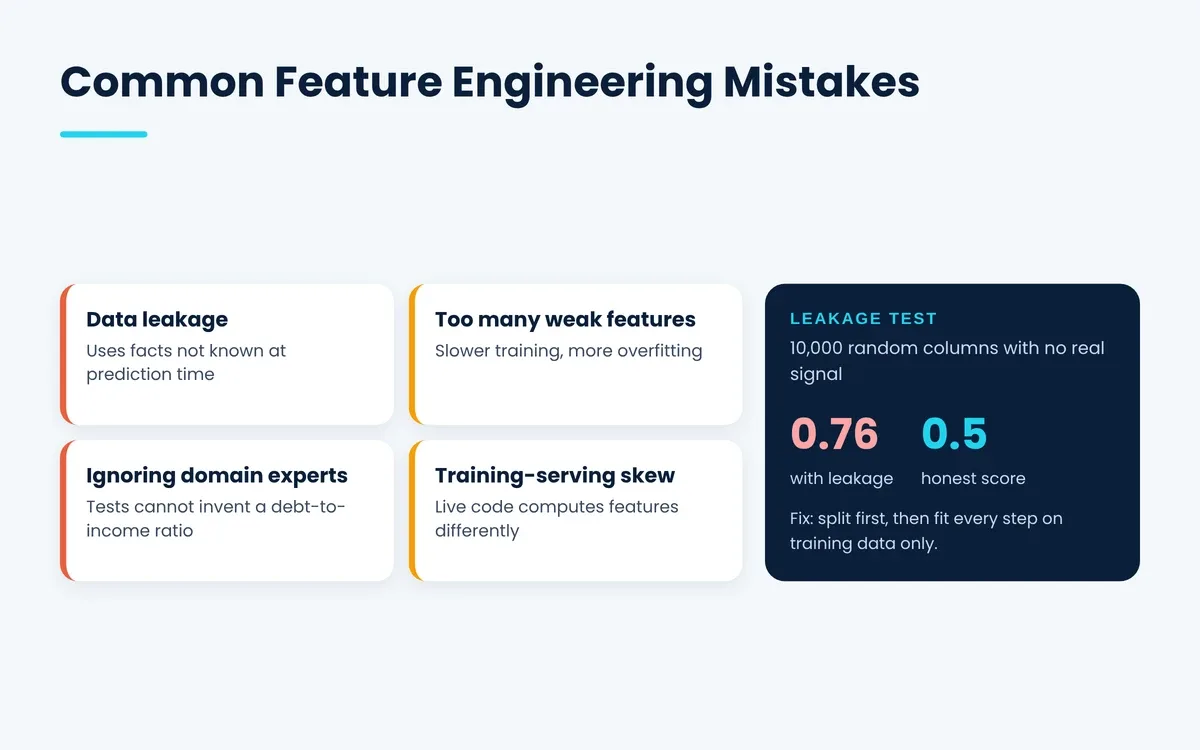
Data leaks, too many weak columns, ignoring the experts, and code that starts to wander when the model makes its debut are the most expensive feature engineering errors.
Data Leakage
Data leakage happens when a feature has information you would not have had at prediction time, so your test scores look too good to be true. The scikit-learn documentation includes a test that uses 10,000 random columns and got 0.76 for the leaky setup with the honest value being 0.5.
The fix is simple and straightforward but is effective every time: split your data into training, validation, and test sets in advance, then fit each cleaning task on the training set only.
Too Many Weak Features
Feeding dozens of weak columns to a model slows the training, increases the risk of overfitting, and dilutes the model. Domingos makes much the same point, cautioning that additional features become a liability once the number begins to run high.
Ignoring Domain Knowledge
No statistical test can come up with a debt to income ratio by itself, but any loan officer will tell you that it is important. That is why the best features are often provided by a quick conversation with individuals who know the business inside and out, rather than more code.
Training-Serving Skew
When your live code builds a feature a certain way and your training code builds a feature a little differently, you'll have a training-serving skew. The model will then encounter inputs that it has not been trained with, and model performance will degrade without a protest.
Do You Still Need Feature Engineering in Deep Learning?
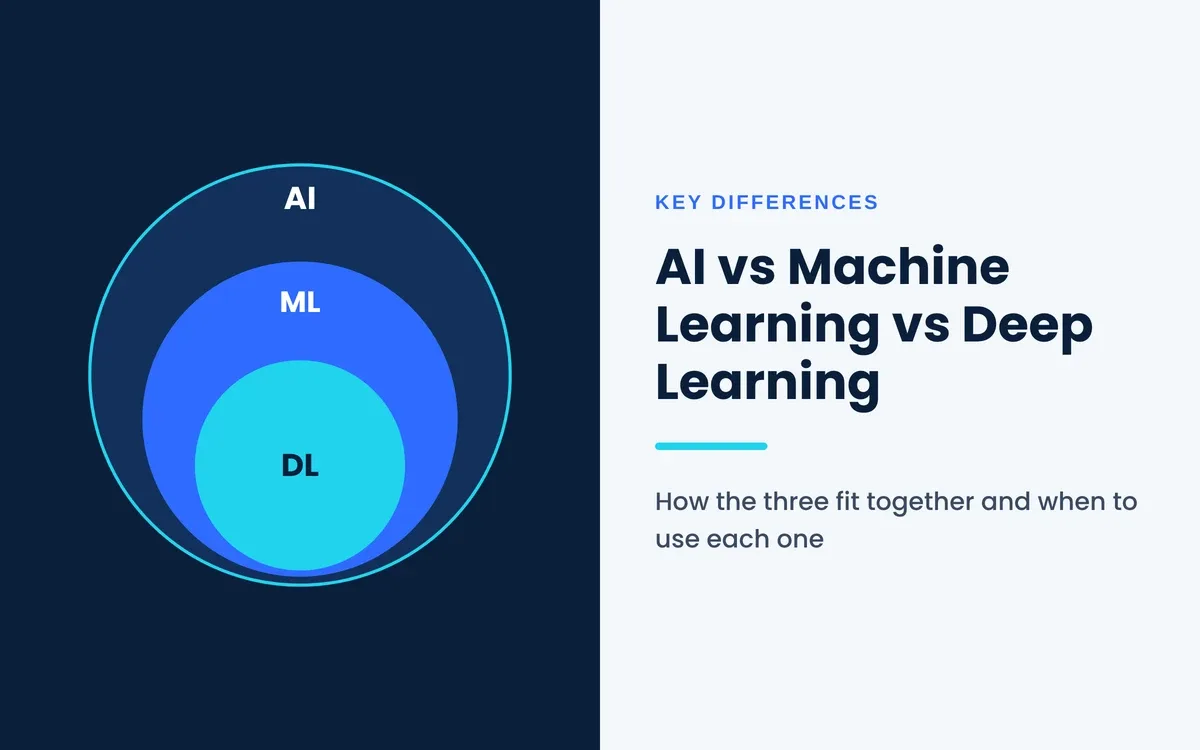
Yes, most business data stored in tables still requires feature engineering, although deep learning can identify features for photos and text on its own.
Image networks learn their edges and shapes directly from the pixels, thus eliminating a lot of the hand-crafted work that vision teams used to grind through. The spreadsheet of business information is another beast as a ratio like debt to income requires context that doesn't necessarily follow from columns of raw data.
Automated feature engineering is slowly being introduced here as well, and that's where MIT CSAIL researchers came up with a method called Deep Feature Synthesis in 2015. Its system beat most human teams in two of three public data science contests, which was a surprising achievement for an all-automated system.
Yet, someone needs to do the sanity checking of all the columns generated and test them correctly before they can ever be used on a live system.
Conclusion
Feature engineering is the process where data from various sources can be made usable to a machine learning model and it can be more important than the machine learning model you choose. Always begin with a clear target, tidy up with care, add features that are backed up by real world knowledge, and be ruthless with removing features that don't help.
Fit all the transformations on the training data only, so the accuracy you report this month will be maintained when new data comes in next month. See how these inputs affect an AI model from the very first training examples to live predictions in the bigger picture.
Frequently Asked Questions
What is the job of a feature engineer?
A feature engineer creates and maintains the data that machine learning models use, typically as part of a data team. That, on a day-to-day basis, involves sifting through raw data, writing the code to transform it, and convincing others that the new column is worth the effort.
What are some examples of feature engineering?
Some common feature engineering examples are the age of a house based on its construction year, the weekday of a date, or debt to income ratio. You'll also see a 0 or 1 column for every product type, or you will see a 7-day average of site visits for a sales forecast.
What are the main types of feature engineering?
There are four major categories: feature creation (new columns), feature transformation, selecting optimal columns and merging old columns into new ones. In real projects, all four are combined, as for a model, some of the columns will need to be new, some will need to be rescaled and the final set is trimmed.
How do you do feature engineering in Python?
Most people use pandas to load their data and build features with its column tools, then wrap the remaining steps in a scikit-learn pipeline. That Pipeline fits each step on training data only, so as to prevent leakage when run on fresh data.
Is feature engineering hard to learn?
The key points of feature engineering can be easily done in Python with a little bit of statistics, as they're mostly basic math. The hard part is judgment, since only practice, along with a lot of trial and error, can show you what is important for a particular business.