


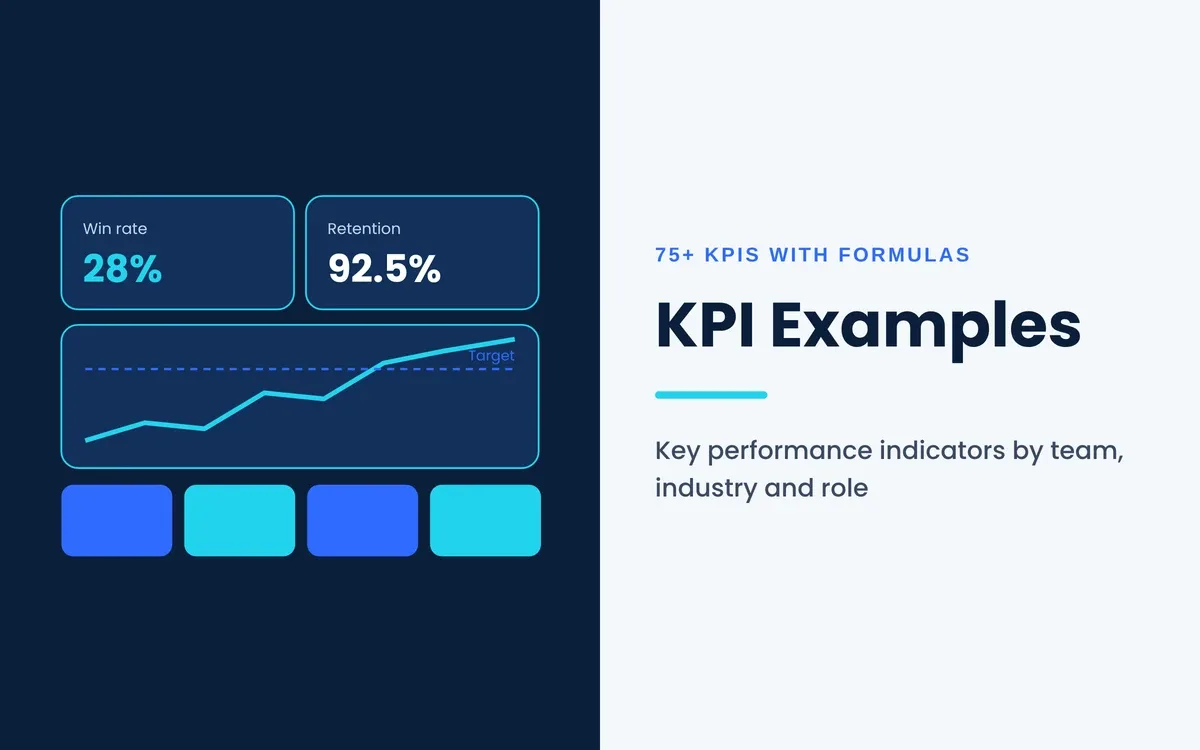
KPI examples show how a business turns a goal into a number it can check every week, month or quarter. A key performance indicator (KPI) takes one strategic objective and attaches a formula, a target, a data source and an owner. The result tells a team whether it is on pace or drifting off course.
Well-chosen indicators give leaders a shared definition of success, flag problems early enough to act on them, and stop teams from drowning in dashboards that track everything yet explain nothing. Companies across the United States use them to run sales pipelines, judge marketing spend and manage cash. Product teams rely on the same discipline to ship software with fewer failures or to decide whether an AI project is paying off.
This guide opens with the KPI definition and what the term means in business. It then covers the parts of a well-built indicator, the main types, plus more than 75 examples of key performance indicators grouped by department, industry or role. Every example carries a formula, and the later sections walk through worked calculations, chart choices and SMART goal statements. A six-step method then helps you pick the measures that deserve a place on your scorecard.
How these formulas were chosen: each one is a practical starting definition drawn from standard finance, HR and engineering practice, with official sources linked where a public standard exists. Organizations often adjust the inputs, so record your own version of every formula before you compare results across teams or periods.
What Is a KPI? The KPI Definition and Meaning
A KPI is a measurable value that shows how well a person, team or company is progressing toward a specific business objective. The key performance indicators definition has three parts: the value is measurable, it ties to a stated objective, and it is tracked over a set period.
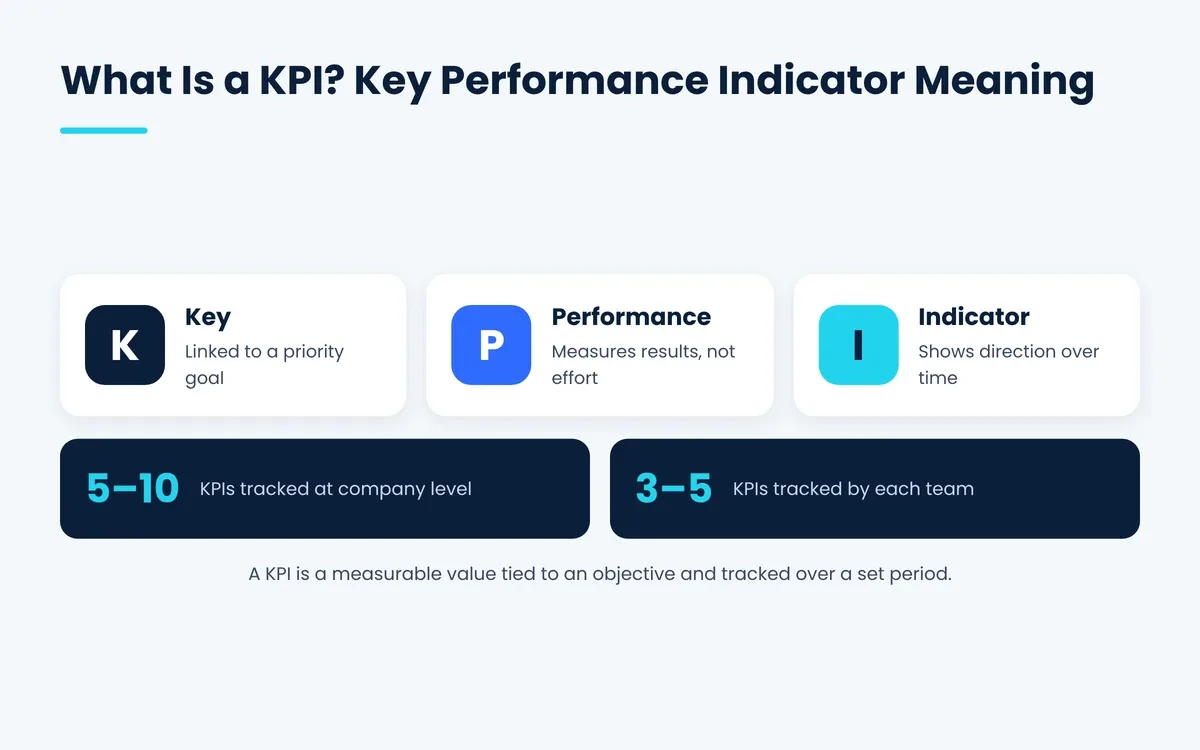
The broader definition of performance indicators is simpler. A performance indicator is any number that describes how a process or result is behaving, such as website visits, units shipped or tickets closed. So what are performance indicators that earn the word "key"? They are the small set, usually 5 to 10 for a company and 3 to 5 for a team, that leadership has agreed to manage the business by. That shorter list is the real KPIs meaning in most boardrooms.
What Does KPI Stand For?
KPI stands for key performance indicator, a measurable value tied to a business goal. "Key" means the measure links to a priority goal, "performance" means it describes results or progress, and "indicator" means it signals direction rather than telling the whole story. When people ask what does KPI mean, the short answer is that it is the scoreboard number for one goal that matters.
What Does KPI Mean in Business?
In business, a KPI is the agreed number that tells leaders whether a strategy is working. A software company growing its subscription base typically picks monthly recurring revenue, net revenue retention and customer churn as its KPIs. A hospital typically picks average emergency room wait time, 30-day readmission rate and patient satisfaction after discharge. The KPI meaning stays the same in both cases, while the specific measures change with the goal.
People searching "what is KPI" or "what are KPIs" usually want one of two things: a plain definition, or a list of examples they can copy. The rest of this guide covers both, starting with how KPIs differ from other numbers on a dashboard.
KPIs vs Metrics vs OKRs: What Is the Difference?
Every KPI is a metric, but most metrics are not KPIs. A metric is any number a team records over time, whereas a KPI is a metric that leadership has tied to a strategic goal with a target and an owner. Objectives and key results (OKRs) are a goal-setting framework, where the key results are often time-boxed versions of KPIs.
| Term | What it is | Example | Time frame |
|---|---|---|---|
| Metric | Any number a team tracks | Page views per day | Ongoing |
| KPI | A metric tied to a strategic goal, with a target and owner | Lead-to-customer conversion rate of 4% | Quarter or year |
| OKR | An objective plus 3 to 5 measurable key results | Objective: enter the Texas market; key result: sign 40 Dallas clients | Usually one quarter |
| Benchmark | An outside or historical reference point for a KPI | Industry average churn of 5% per month | Reference only |
What are KPI metrics in practice? They are the handful of metrics promoted to KPI status. Page views can feed a conversion-rate KPI, yet page views on their own rarely deserve a seat in the boardroom report.
What Are the 5 Key Performance Indicators Most Businesses Track?
The 5 key performance indicators most businesses track are revenue growth rate, net profit margin, customer acquisition cost, customer retention rate and employee turnover rate. Together they cover growth, profitability, sales efficiency, customer health and workforce stability, which are the five areas where small problems turn into large ones fastest.
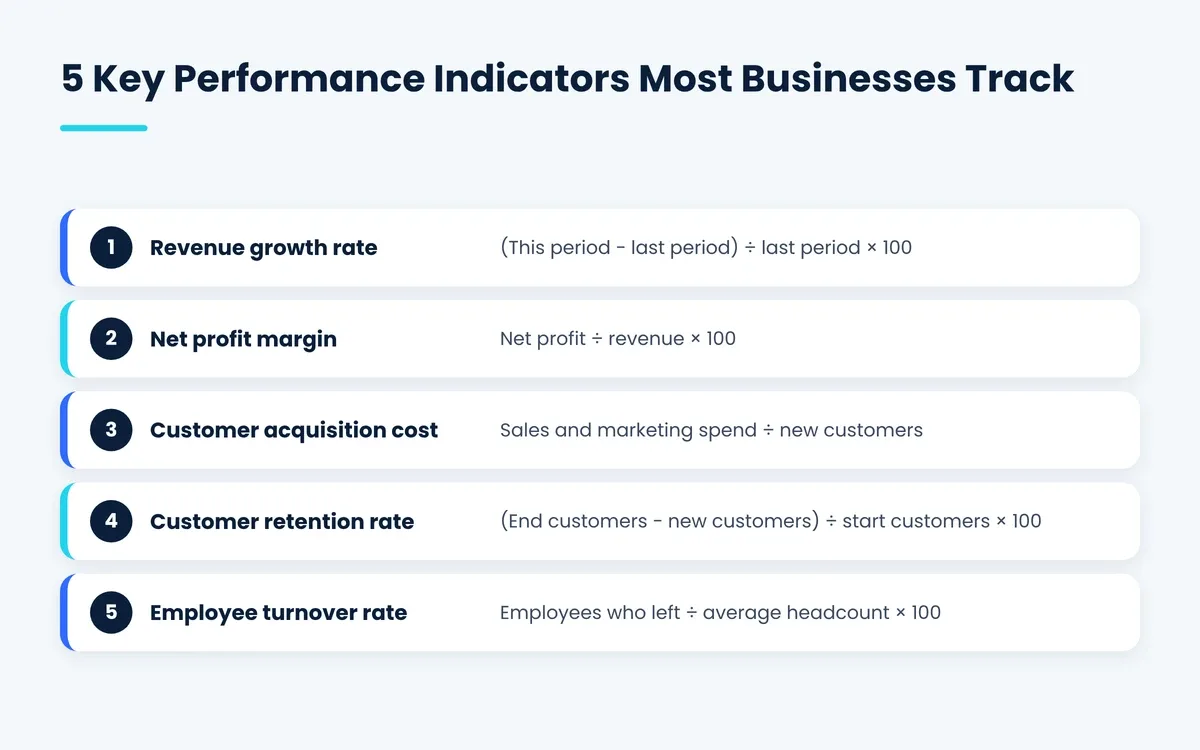
1. Revenue growth rate = (current period revenue − prior period revenue) ÷ prior period revenue × 100. It shows whether the business is expanding and how quickly.
2. Net profit margin = net income ÷ revenue × 100. It shows how many cents of each sales dollar the company keeps after every expense.
3. Customer acquisition cost (CAC) = total sales and marketing spend ÷ new customers gained in the same period. It shows what each new customer really costs, provided you decide upfront whether salaries, commissions, agency fees and software tools count as spend.
4. Customer retention rate = ((customers at end − new customers) ÷ customers at start) × 100. It shows whether customers stay long enough to be profitable, as long as reactivated accounts are handled the same way every period.
5. Employee turnover rate = separations ÷ average headcount × 100. It shows whether the company keeps the people who do the work, so state whether the figure covers all separations or voluntary exits only.
These key performance indicators examples make a sensible starting scorecard for a founder who has never formally tracked KPIs. A company can then add department measures underneath, which the sections below list in detail.
The 7 Parts of a Well-Built KPI
A well-built KPI has 7 parts: a name, a definition, a formula, a target, a data source, a reporting frequency and an owner. Leave out any one of them and the number turns into an argument instead of a decision tool.
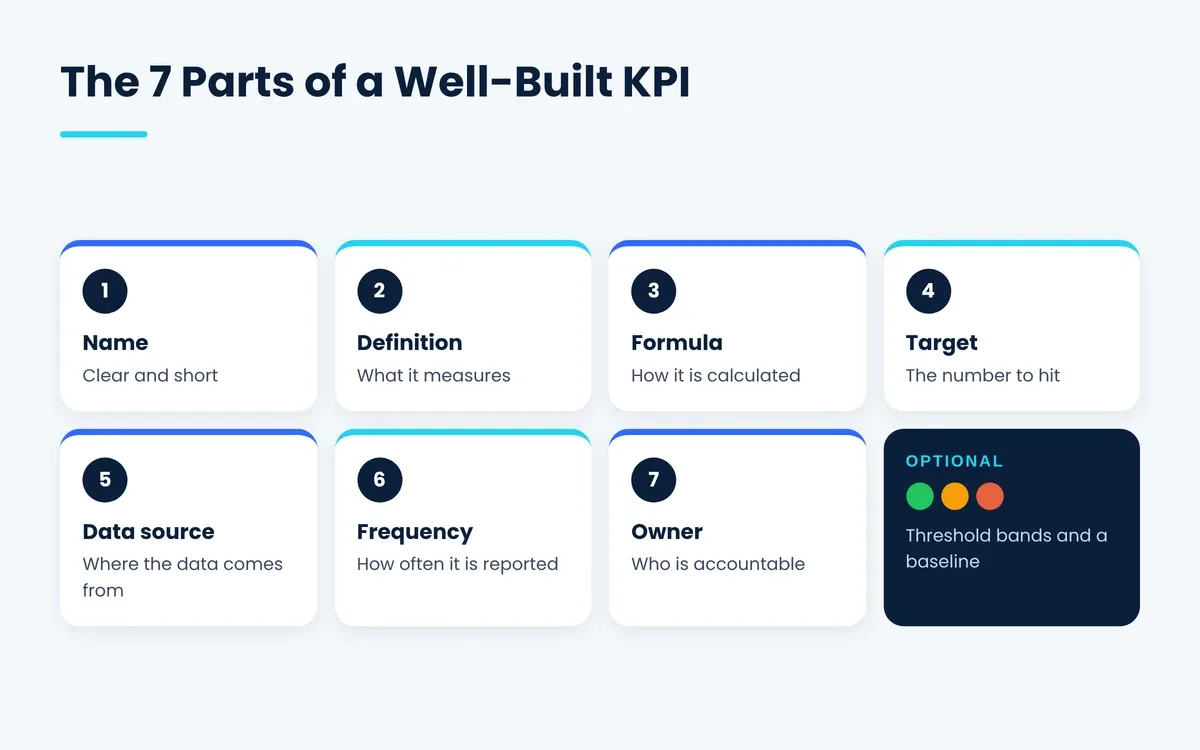
- Name gives the indicator a short label everyone uses the same way, such as "Gross revenue retention."
- Definition states in one sentence what the number measures and what it excludes.
- Formula spells out the exact calculation, including which records count.
- Target sets the value the team is aiming for and the date it must be reached.
- Data source names the system of record, such as Salesforce, QuickBooks, Google Analytics 4 or an HR platform.
- Reporting frequency fixes how often the number is refreshed and reviewed, whether daily, weekly, monthly or quarterly.
- The owner identifies the one person accountable for moving the number and explaining it.
Two optional fields make a KPI far more useful in meetings. A threshold band (green, yellow, red) tells reviewers when to worry, and a baseline records where the number started so progress is visible.
KPI Format Sample You Can Copy
A KPI format sample is a one-row record that holds all seven parts of an indicator in a fixed layout. The key performance indicators sample below shows three filled rows from a B2B services company, ready to paste into a spreadsheet or dashboard spec.
| Field | Sales KPI sample | Marketing KPI sample | People KPI sample |
|---|---|---|---|
| Name | Win rate | Marketing qualified leads (MQLs) | 90-day new hire retention |
| Definition | Share of sales-qualified opportunities that close as won | Leads that meet the agreed fit and engagement score | New hires still employed 90 days after start |
| Formula | Won deals ÷ closed deals × 100 | Count of leads scoring 60+ in the CRM | Hires retained at day 90 ÷ hires in cohort × 100 |
| Target | 28% by Q4 (baseline 21%) | 450 per month by June | 92% for 2026 hires |
| Data source | CRM opportunity records | Marketing automation platform | HRIS employee records |
| Frequency | Weekly | Weekly | Monthly |
| Owner | VP of Sales | Demand generation lead | HR business partner |
This kpi sample format works for a team of five or a company of five thousand. The only change at scale is that each row links to a live data pipeline instead of a manual export.
Here is how a manager reads that sample in a real review. Suppose the win rate sits at 24% in week 30, against a 21% baseline and a 28% target. The number is moving the right way yet still trails the pace needed by Q4, so the VP of Sales checks the leading signal first. If pipeline coverage has dropped below three times quota, the fix is more qualified pipeline rather than more sales coaching.
Types of Key Performance Indicators
Key performance indicators fall into 4 main pairs of types: leading vs lagging, quantitative vs qualitative, input vs output, and operational vs strategic. Most healthy scorecards mix at least the first pair, so the team sees both early signals and final results.
Leading vs Lagging Indicators
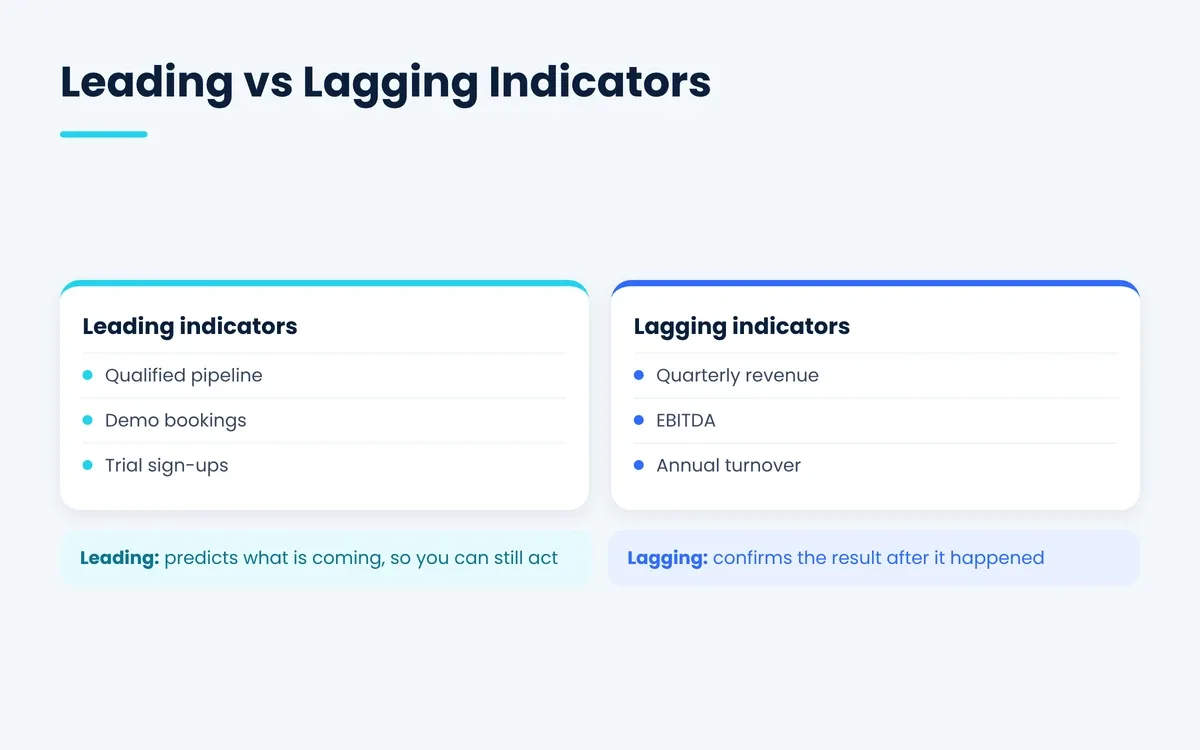
A leading indicator moves before the result does. Qualified pipeline value, demo bookings and website trial sign-ups are leading measures for revenue. A lagging indicator confirms what already happened, such as quarterly revenue, EBITDA or annual employee turnover. Leading measures let a team act while there is still time, whereas lagging measures prove whether the action worked.
Quantitative vs Qualitative Indicators
Quantitative indicators are pure counts, rates or currency amounts. Qualitative indicators turn opinions into numbers through a fixed scale, as with Net Promoter Score (NPS), customer satisfaction score (CSAT), customer effort score trends or employee engagement survey results.
Input, Process, Output and Outcome Indicators
Input indicators track resources spent, like hours or budget. Process indicators track how work moves, like cycle time. Output indicators count what was produced, like features released. Outcome indicators measure the change that output created, like a rise in customer retention. Outcome measures carry the most weight with executives, so each department should own at least one.
Positive Performance Indicators Examples
A positive performance indicator is one where a higher number is better, which makes it easy to celebrate and easy to read on a chart. Here are eight positive performance indicators examples:
- Customer retention rate rising from 86% to 91%
- First contact resolution rate above 75%
- On-time delivery rate above 97%
- Employee referral hires making up 30% of new hires
- Gross margin climbing two points year over year
- Organic search traffic growing 15% per quarter
- Remote onboarding completion rate of 95% within the first week
- Uptime of 99.95% across production systems
Success indicators examples work the same way at the project level. A software launch can define success as 2,000 active users in 60 days, a crash-free session rate above 99.5%, and an app store rating of 4.5 or higher.
Key Performance Areas and Key Performance Indicators
Key performance areas (KPAs) are the broad areas of responsibility a role or company must deliver on. Key performance indicators are the numbers that show how well each area is going. A KPA answers "what are we responsible for?" and a KPI answers "how are we doing at it?"
The difference between key performance areas and key performance indicators shows up clearly in a job description. A customer success manager usually has three KPAs: onboarding, retention and expansion. Each one then gets its own KPI, such as time to first value, gross revenue retention and expansion revenue.
Key performance factors sit one step further back. They are the conditions that drive a KPI up or down, such as staffing levels, product quality or response speed. Tracking the factor alongside the KPI helps a manager see why a number moved.
The Baldrige Criteria offer a ready-made set of organizational KPAs. A Baldrige issue sheet from the National Institute of Standards and Technology (NIST) lists six results areas. They are product and service outcomes, customer-focused results, financial and market results, human resource results, organizational effectiveness results, and leadership and social responsibility results.
Key Performance Areas Template
Use this key performance areas template to map each area to its indicators before you build a dashboard.
| Key performance area | Goal | KPI | Target | Owner |
|---|---|---|---|---|
| Financial health | Grow profitably | Net profit margin | 12% for FY2026 | CFO |
| Customers | Keep and grow accounts | Net revenue retention | 110% | VP of Customer Success |
| Operations | Deliver on time | On-time, in-full delivery rate | 96% | Operations Director |
| Workforce | Retain skilled staff | Voluntary turnover rate | Below 10% per year | Head of People |
| Product | Ship reliable software | Change fail rate | Below 10% | Engineering Manager |
Examples of KPIs for Sales, Marketing, Finance and Customer Service
The examples of KPIs, sometimes searched as KPIs examples, cover the four departments that most often report to the CEO, with the formula and the question each one answers. Pick two or three per department at first, then add more only when the team can act on them.
Sales KPIs
| KPI | Formula | What it tells you |
|---|---|---|
| Win rate | Won deals ÷ closed deals × 100 | How well reps convert real opportunities |
| Average deal size | Total won revenue ÷ number of won deals | Whether the team sells larger or smaller contracts |
| Sales cycle length | Sum of days from opportunity to close ÷ won deals | How long revenue takes to arrive |
| Pipeline coverage | Open pipeline value ÷ quota for the period | Whether there is enough pipeline to hit the number |
| Quota attainment | Rep revenue ÷ rep quota × 100 | How many reps are on track |
| Lead response time | Average minutes from lead creation to first contact | How fast the team acts on demand |
Marketing KPIs
| KPI | Formula | What it tells you |
|---|---|---|
| Cost per lead | Campaign spend ÷ leads generated | How efficiently campaigns create demand |
| MQL-to-SQL conversion rate | SQLs ÷ MQLs × 100 | Whether marketing sends leads sales can use |
| Return on ad spend (ROAS) | Revenue from ads ÷ ad spend | Which paid channels earn their budget |
| Organic traffic growth | (This period's organic sessions − last period's) ÷ last period's × 100 | Whether search visibility is improving |
| Landing page conversion rate | Conversions ÷ landing page visitors × 100 | How well a page turns visits into action |
| Average scroll depth | Sum of maximum scroll percentage per pageview ÷ pageviews | How far readers get through an article |
| Average engagement time | Total engaged seconds on a page ÷ users who viewed it | How long readers actively spend with the content |
Finance KPIs
| KPI | Formula | What it tells you |
|---|---|---|
| Gross profit margin | (Revenue − cost of goods sold) ÷ revenue × 100 | How profitable each sale is before overhead |
| Operating cash flow (simplified) | Net income + non-cash expenses ± working capital changes | A quick estimate of cash from operations; use the reported cash flow statement for official figures |
| Days sales outstanding (DSO) | Accounts receivable ÷ total credit sales × days in period | How fast customers pay |
| Current ratio | Current assets ÷ current liabilities | Whether short-term bills can be covered |
| Budget variance | (Actual spend − budgeted spend) ÷ budgeted spend × 100 | How closely teams stick to plan; for costs, a positive result means overspending |
| Monthly net cash burn | Cash outflows − cash inflows during the month | How much cash a startup consumes each month |
| Cash runway | Available cash ÷ average monthly net cash burn | How many months the business can operate at the current pace |
Customer Service KPIs
| KPI | Formula | What it tells you |
|---|---|---|
| First response time | Average time from ticket creation to first reply | How quickly customers hear back |
| First contact resolution rate | Tickets solved on first contact ÷ total tickets × 100 | How often issues end in one touch |
| CSAT | Responses of 4 or 5 on a 5-point scale ÷ total responses × 100 | How customers rate a single interaction, if the survey is sent after every resolved ticket |
| Net Promoter Score | % promoters (9-10) − % detractors (0-6) | How likely customers are to recommend you |
| Customer effort score | Average answer on a 1 to 7 scale to "The company made it easy to handle my issue" | How much friction customers face; higher means easier |
| Ticket backlog | Open tickets older than the service-level target | Whether the team is keeping up |
Examples of Key Performance Measures for HR, Operations and Supply Chain
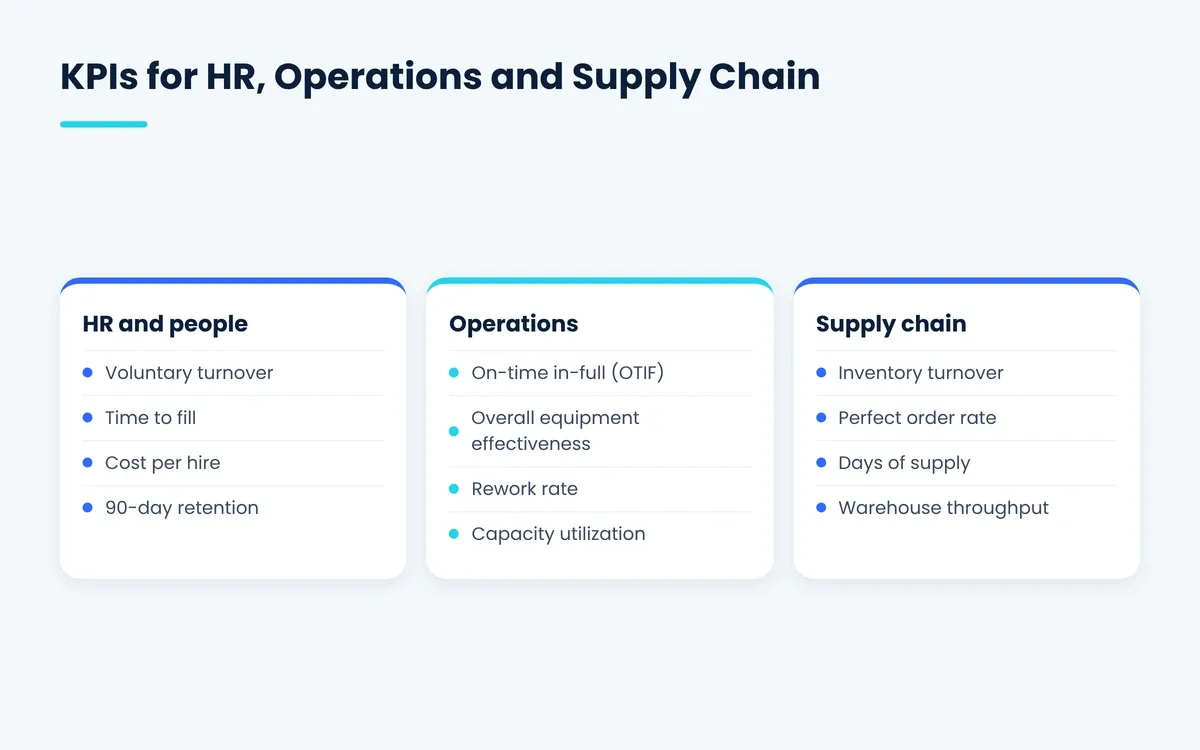
HR, operations and supply chain teams track efficiency, quality and people stability. Their key performance measures examples lean toward rates, cycle times or costs per unit. These measures rarely make headlines, yet they decide whether the business can deliver on what sales promised.
HR and People KPIs
- Voluntary turnover rate = voluntary leavers ÷ average headcount × 100. The Bureau of Labor Statistics (BLS) put the national quits rate at 2.0% for July 2025, a useful outside reference point for US employers comparing monthly figures.
- Time to fill = average days from job posting to accepted offer.
- Cost per hire = (internal recruiting costs + external recruiting costs) ÷ total hires.
- Offer acceptance rate = offers accepted ÷ offers extended × 100.
- 90-day new hire retention = hires still employed at day 90 ÷ hires in the cohort × 100.
- Employee referral quality index = share of referral hires rated "meets" or "exceeds" at their first review.
- Diversity hiring pipeline ratio = candidates from underrepresented groups at each stage ÷ total candidates at that stage.
- Training completion rate = employees who finished required training ÷ employees assigned × 100.
Operations KPIs
- Order fulfillment cycle time = average hours from order placement to shipment, often reported in both hours and business days.
- On-time, in-full (OTIF) rate = orders delivered complete and on time ÷ total orders × 100.
- Overall equipment effectiveness (OEE) = availability × performance × quality.
- Rework rate = units needing rework ÷ total units produced × 100.
- Capacity utilization = actual output ÷ maximum possible output × 100.
- Energy use per unit = kilowatt-hours consumed ÷ units produced, a common measure behind energy consumption reduction targets.
Supply Chain KPIs
- Inventory turnover = cost of goods sold ÷ average inventory value.
- Perfect order rate = orders with no errors in quantity, product, delivery or paperwork ÷ total orders × 100.
- Days of supply = current inventory ÷ average daily usage.
- Supplier on-time delivery = supplier orders received on schedule ÷ total supplier orders × 100.
- Warehouse throughput = units shipped per labor hour, or per square foot (0.093 square meters) of storage for space planning.
- Supplier diversity spend = spend with certified diverse suppliers ÷ total supplier spend × 100.
Key Metrics Examples for Software, Web Apps and AI Projects
Software, web and AI teams track delivery speed, system stability, user behavior and model accuracy. That focus makes their key metrics examples more technical than those of other departments. Many of these numbers come straight from engineering tools, so they can be automated from the first sprint.
Software Delivery KPIs
The DORA research program defines five software delivery metrics that many US engineering teams now treat as their core KPIs. They work best when measured for one application or service at a time, not averaged across a whole company:
- Deployment frequency shows how often code reaches production.
- Change lead time measures the time from a code commit to that change running in production.
- Change fail rate = deployments that cause a failure ÷ total deployments × 100.
- Failed deployment recovery time measures how long it takes to restore service after a bad release.
- Deployment rework rate tracks the share of deployments that were unplanned fixes for production problems.
Teams building custom software usually add escaped defect rate, sprint goal completion and cybersecurity incident response times to that list.
Web Application KPIs
- Core Web Vitals pass rate, judged against the thresholds in Google's web.dev guidance. Google judges a page on real-user field data at the 75th percentile, not a single lab test. A page passes with Largest Contentful Paint within 2.5 seconds, Interaction to Next Paint within 200 milliseconds and Cumulative Layout Shift of 0.1 or less.
- Conversion rate on key flows, such as sign-up, checkout or demo request.
- Uptime percentage = minutes available ÷ total minutes in the period × 100.
- Error rate = failed requests ÷ total requests × 100.
A team planning a new portal with a web development company should agree on these targets before design starts. Page speed costs far less to build in than to retrofit later. The trade-offs behind app-like websites are covered in our guide to progressive web apps.
Mobile App KPIs
- Day-1, day-7 and day-30 retention = users active on that day ÷ users who installed in the cohort × 100.
- DAU/MAU ratio = average daily active users ÷ monthly active users, usually shown as a percentage, with "active" defined by one fixed action such as opening the app.
- Crash-free session rate = sessions without a crash ÷ total sessions × 100.
- Activation rate = users who complete the key first action ÷ new installs × 100.
Activation is the number many founders underestimate. The EyeCast case study reports a 73% increase in user activation after the team added AI-driven onboarding and simpler authentication. Teams scoping an app with a mobile app development company can read how long a mobile app build takes to set realistic launch-date KPIs.
AI Project KPIs
AI implementation success rates depend on measuring the model and the business result separately. A model can score well in testing and still fail to move the outcome it was built for.
- Model accuracy, precision and recall on a held-out test set, which depends heavily on the quality of the training data.
- Automation rate = tasks completed by the AI system without human help ÷ total tasks × 100.
- Human override rate = AI decisions reversed by staff ÷ total AI decisions × 100.
- Cost per resolved request before and after deployment.
- Time saved per user per week, confirmed through system logs rather than surveys alone.
Readers new to the field can start with what artificial intelligence is and what an AI model is before setting targets. Companies planning AI development or AI agent development should write these KPIs into the project brief, so the proof of concept is judged on business impact instead of demo quality.
KPI Examples by Industry
Industry KPIs reflect how each sector makes money and where it carries risk, so the same company size can need very different scorecards. The lists below give five to six example performance indicators for eight US industries.
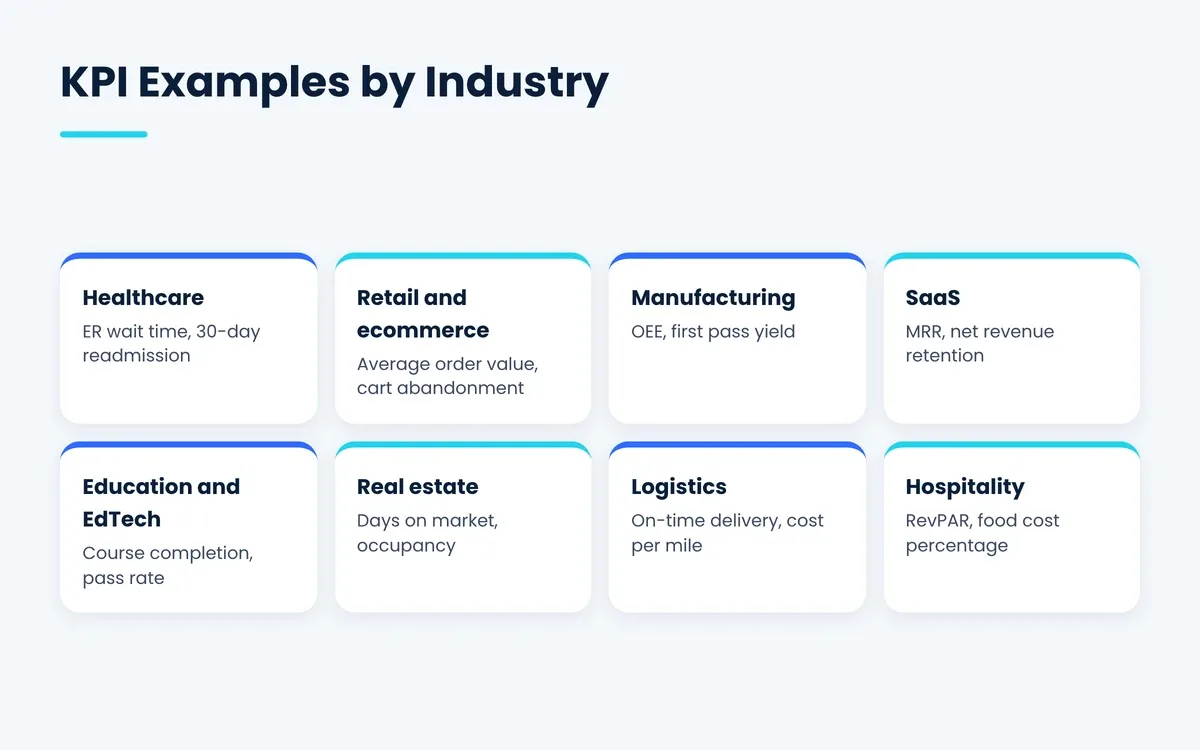
Healthcare
- Average emergency room wait time, in minutes
- 30-day hospital readmission rate
- Patient satisfaction post-discharge, often from HCAHPS survey scores
- Bed occupancy rate
- Claims denial rate
- Medication error rate per 1,000 doses
Retail and Ecommerce
- Average order value (AOV) = revenue ÷ number of orders
- Cart abandonment rate = abandoned carts ÷ carts created × 100
- Product return rate, broken down by reason to find the cause
- Sales per square foot (or per square meter) for physical stores
- Repeat purchase rate
- Customer lifetime value (CLV)
Manufacturing
- Overall equipment effectiveness (OEE)
- First pass yield = units passing inspection the first time ÷ units produced × 100
- Scrap rate
- Unplanned downtime hours per month
- Safety incident rate per 200,000 hours worked
SaaS and Subscription Software
- Monthly recurring revenue (MRR) and annual recurring revenue (ARR)
- Net revenue retention (NRR)
- Logo churn rate
- CAC payback period, in months
- LTV-to-CAC ratio
Education and EdTech
- Course completion rate
- Learner engagement minutes per week
- Assessment pass rate
- Platform uptime during peak exam periods
Uptime under load is the KPI that keeps EdTech leaders awake. The KIPS LMS case study describes a learning platform that has served more than 50,000 students with live classes, assessments and progress tracking on web or mobile.
Real Estate
- Days on market
- List-to-sale price ratio
- Lead-to-showing conversion rate
- Occupancy rate for rental portfolios
Logistics and Transportation
- On-time delivery rate
- Cost per mile (or per kilometer)
- Fuel consumption per 100 miles
- Load factor = cargo carried ÷ vehicle capacity × 100
Hospitality and Food Service
- Revenue per available room (RevPAR)
- Table turnover rate
- Food cost percentage
- Online review score average
Key Performance Indicators for Managers
Key performance indicators for managers measure team output, team health and how well the manager removes obstacles, rather than the manager's personal output. A manager's scorecard should answer whether the team hits its goals and whether it can keep doing so next quarter.
Here are eight manager-level measures worth considering:
- Team goal attainment = team KPIs on target ÷ total team KPIs × 100.
- Voluntary turnover on the team, compared with the company average.
- Employee engagement score from a quarterly pulse survey.
- Time to productivity for new hires, measured in weeks until they meet a baseline output.
- Cross-departmental collaboration score, taken from peer feedback by partner teams.
- One-on-one completion rate = scheduled one-on-ones held ÷ scheduled × 100.
- Remote team productivity benchmarks, such as tasks completed per sprint compared with the team's own six-month average.
- Budget variance for the manager's cost center.
At the executive level, a CEO scorecard usually blends the five core company KPIs with one or two strategic bets. Innovation pipeline velocity, counted as ideas moved from concept to pilot per quarter, is a common choice for growth-stage firms.
Robert Kaplan and David Norton introduced the balanced scorecard in Harvard Business Review in 1992. It remains the most common way to keep a leadership scorecard from tilting toward finance alone. It spreads measures across four perspectives: financial, customer, internal business process, and learning and growth. Federal guidance follows the same thinking, and the U.S. Office of Personnel Management (OPM) handbook on measuring employee performance discusses the importance of balancing measures when supervisors build performance plans.
KPI Goals Examples: How to Write SMART KPIs
A SMART KPI is specific, measurable, achievable, relevant and time-bound, which turns a vague hope into a target someone can own. The acronym traces back to George T. Doran's November 1981 article in Management Review, "There's a S.M.A.R.T. Way to Write Management's Goals and Objectives." It is still the fastest test for a weak goal.
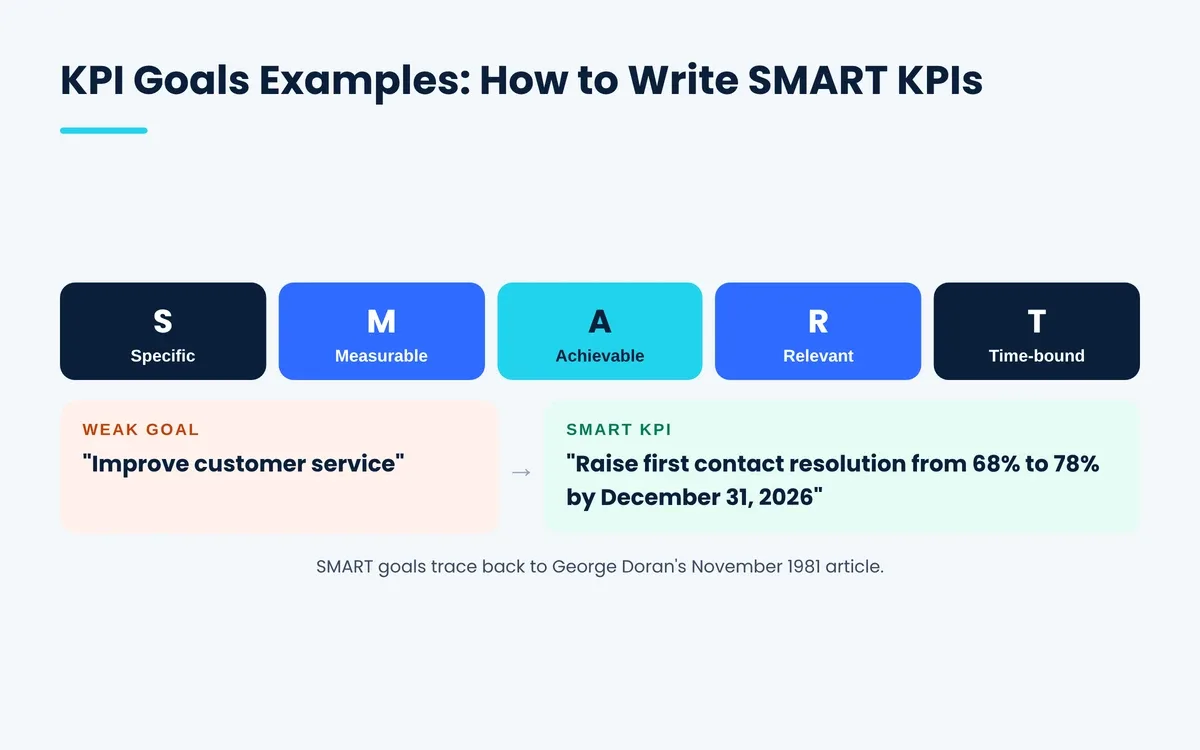
Compare a weak goal with its SMART version:
- Weak: "Improve customer service." SMART: "Raise first contact resolution from 68% to 78% by December 31, 2026, measured weekly in the help desk system, owned by the Support Manager."
- Weak: "Get more leads." SMART: "Generate 450 marketing qualified leads per month by June 30, tracked in the CRM, owned by the Demand Generation Lead."
- Weak: "Reduce churn." SMART: "Cut monthly logo churn from 3.1% to 2.2% by Q3, reported monthly from billing data, owned by the VP of Customer Success."
- Weak: "Ship faster." SMART: "Move deployment frequency from weekly to daily for the core API by the end of Q2, tracked in the CI/CD pipeline, owned by the Engineering Manager."
- Weak: "Hire better people." SMART: "Lift 90-day new hire retention to 92% for all 2026 hires, reported monthly from the HRIS, owned by the Head of People."
Each of these kpi goals examples, the most practical examples of KPI writing, fits the number, baseline, target, deadline, data source and owner into one statement. That single sentence becomes the row in your KPI tracker.
How Do You Calculate a KPI? Worked Calculations
To calculate a KPI, pull the raw counts for one fixed period from the agreed data source and plug them into the documented formula. Then compare the result with the target and with the prior period. The five worked examples below use realistic figures for a US company with about $2.4 million in annual revenue.
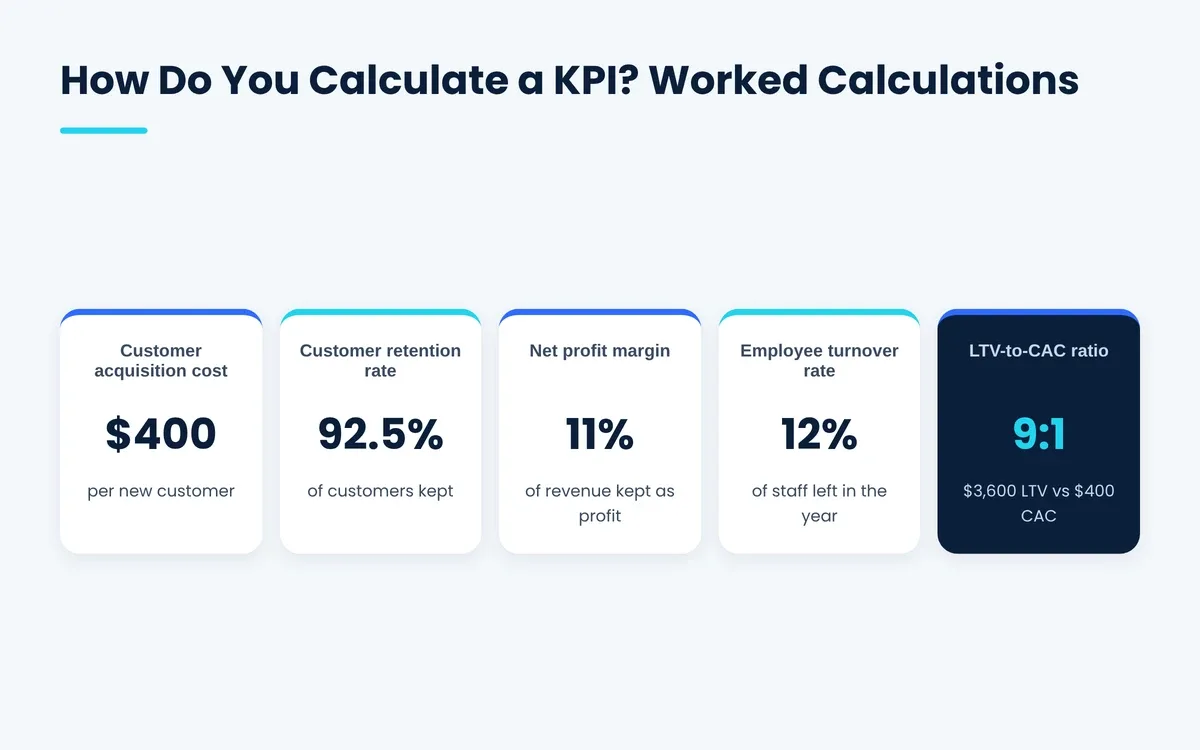
1. Customer acquisition cost. The company spent $84,000 on sales plus marketing in Q2, winning 210 new customers. CAC = $84,000 ÷ 210 = $400 per customer.
2. Customer retention rate. It started the year with 1,200 customers, ended with 1,260, and added 150 new ones along the way. Retention = ((1,260 − 150) ÷ 1,200) × 100 = 92.5%.
3. Net profit margin. Revenue reached $2,400,000 and net income came to $264,000. Margin = $264,000 ÷ $2,400,000 × 100 = 11%.
4. Employee turnover rate. Eighteen people left during the year against an average headcount of 150. Turnover = 18 ÷ 150 × 100 = 12%.
5. LTV-to-CAC ratio. Monthly revenue per account is $150, gross margin is 80%, and the average customer stays 30 months. LTV = $150 × 0.80 × 30 = $3,600. With CAC at $400, the ratio is 9:1, well above the common 3:1 rule of thumb. That benchmark is an informal investor guideline rather than a standard, and a very high ratio can mean the company is underinvesting in growth.
Arithmetic is the easy part of the job, while the hard part is agreeing on definitions, such as whether a customer who pauses a subscription counts as churned. Write those rules into the KPI definition once, so every report calculates the same way.
Performance Indicator Chart and KPI Graph Examples
The right performance indicator chart depends on what the KPI needs to show: a trend, a comparison, progress toward a target, or a share of a whole. Picking the wrong chart hides the signal, even when the number itself is correct.
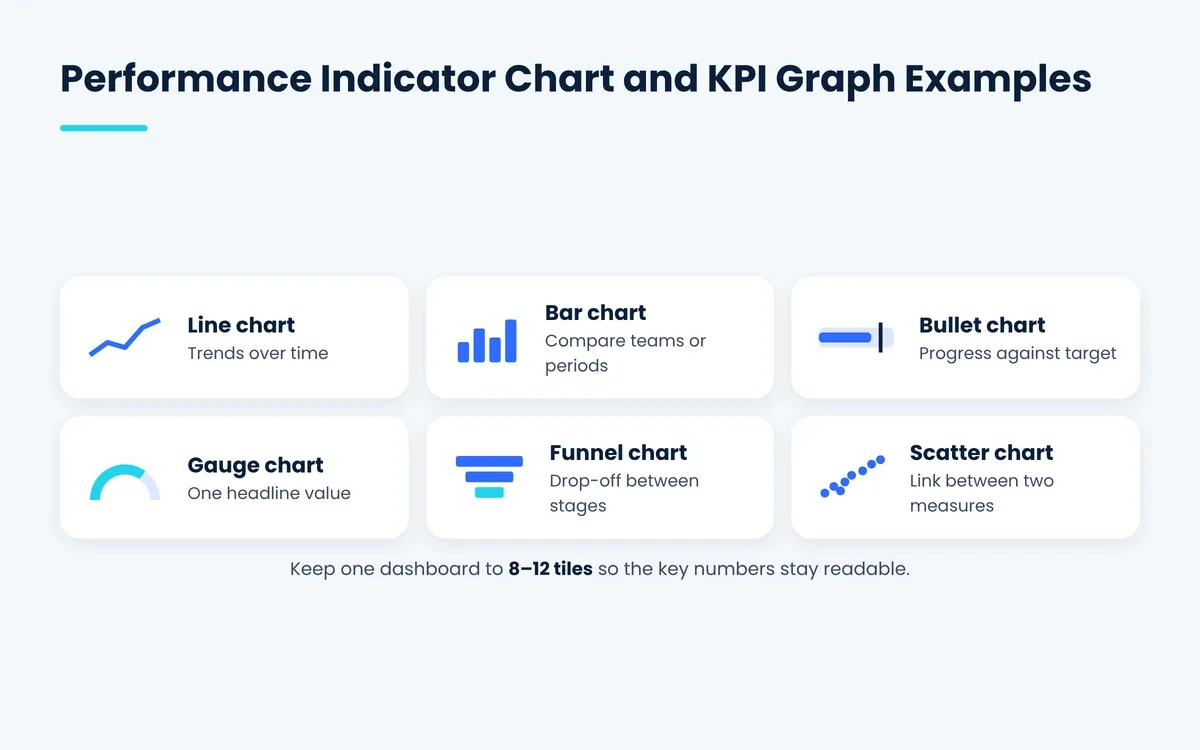
Here are six KPI graph examples matched to the job each chart does best:
- Line charts show trends over time, which suits revenue growth, website traffic or monthly churn.
- Bar charts compare categories, which suits sales by region, tickets by agent or defects by product line.
- Bullet charts and progress bars show actual against target, which suits quota attainment or budget use.
- Gauges and single-number tiles show one headline value with a color band, which suits uptime or NPS on an executive screen.
- Funnel charts show drop-off between stages, which suits lead-to-customer conversion or app onboarding.
- Scatter plots show the link between two measures, which suits marketing spend against leads or tenure against performance.
A good KPI dashboard puts no more than 8 to 12 tiles on one screen, shows the target next to every value, and lets viewers click through to the detail. Clear layout matters as much as clean data, which is why many teams bring in a UI/UX design team before building internal reporting tools.
How to Choose the Right KPIs in 6 Steps
To choose the right KPIs, start from the goal, test each candidate measure against a short quality checklist, and keep only the few that someone will act on. The six steps below work for a whole company or a single team.
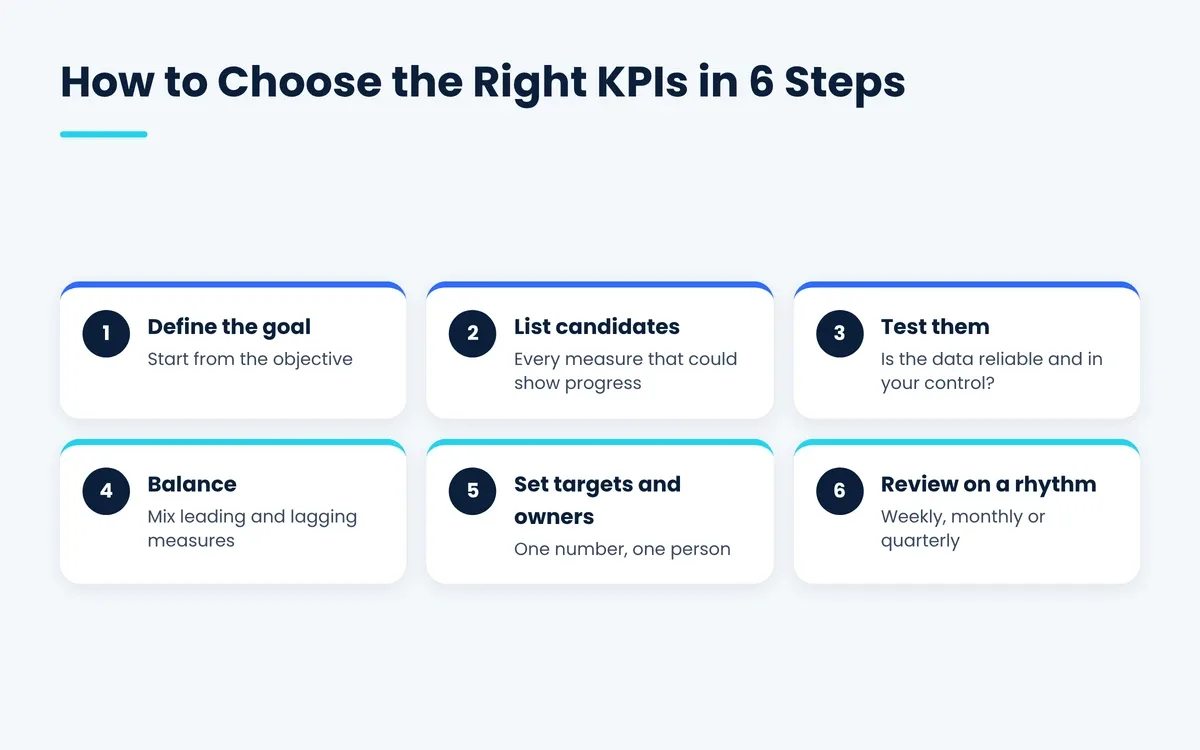
1. Write down the goal first. State the objective in plain words, such as "grow recurring revenue 25% this year," before looking at any data.
2. List candidate measures. Brainstorm every number that could show progress, including leading and lagging options.
3. Test each candidate. Keep a measure only if it ties to the goal and the team can influence it. It should come from a reliable source, with everyone reading it the same way.
4. Balance the set. Pair each lagging result with at least one leading signal, and check that no single measure can be gamed without another one catching it.
5. Set targets and owners. Add a baseline, a target, a deadline and one accountable owner to every KPI that survives.
6. Review on a fixed rhythm. Look at operational KPIs weekly and strategic KPIs monthly or quarterly, then retire any measure that has not driven a decision in two review cycles.
This process is how leaders define KPI key performance indicators that last longer than one planning season. It mirrors the discovery plus strategy stages in our delivery process, where scope and success measures are agreed before any build starts.
Common KPI Mistakes
The 5 most common KPI mistakes are too many measures, vanity metrics, missing owners, shifting targets and numbers that people learn to game. Each one quietly turns a scorecard into noise.
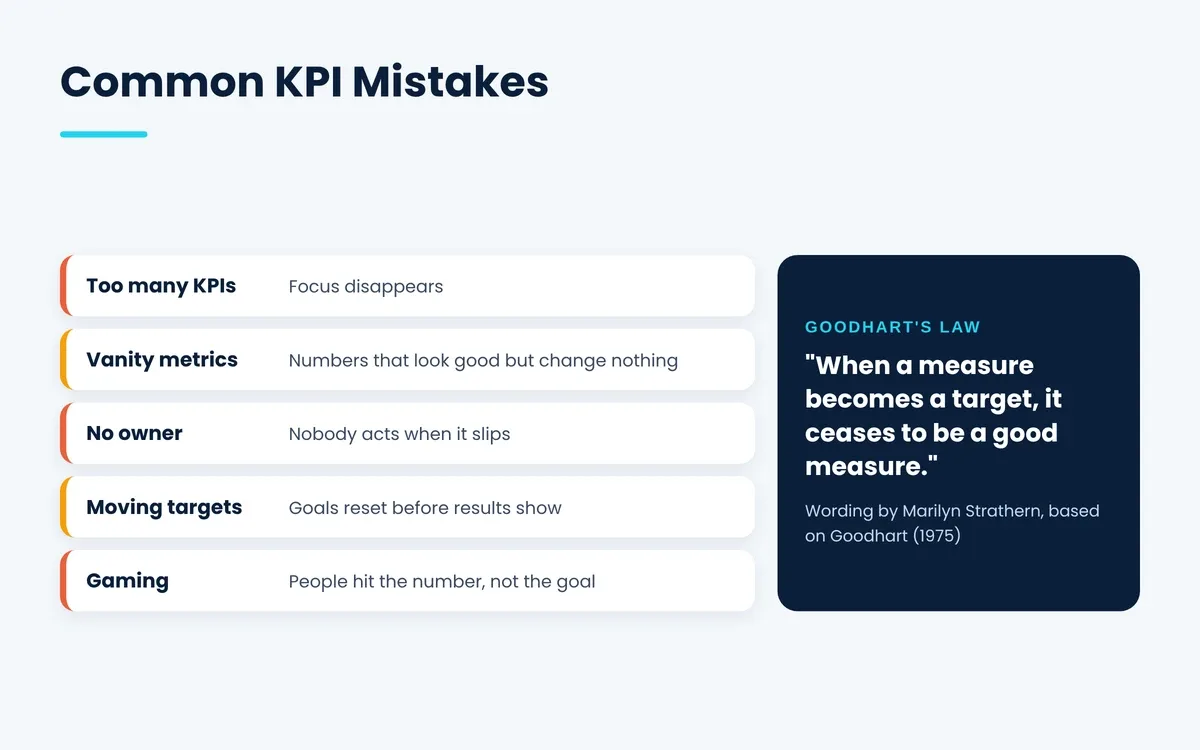
- Too many KPIs. A dashboard with 40 "key" indicators has no key indicators. Cap each team at three to five.
- Vanity metrics. Social followers and raw page views feel good but rarely change a decision. Swap them for conversion or retention measures.
- No owner. A KPI owned by "the team" is owned by nobody, so name one accountable person.
- Moving targets. Resetting a target every month erases the trend. Hold targets for at least a quarter unless the business itself changes.
- Gaming the number. Economist Charles Goodhart made the original point in 1975. Anthropologist Marilyn Strathern later gave it the popular form: when a measure becomes a target, it ceases to be a good measure. Pair speed KPIs with quality KPIs, such as first response time with CSAT, so one cannot be pushed at the expense of the other.
How O2SOFT Turns KPIs Into Working Dashboards
O2SOFT builds the software that collects, calculates and displays KPIs, from internal dashboards to customer-facing analytics inside web or mobile products. Most companies already have the data spread across a CRM, an accounting tool, a help desk and spreadsheets. The work is connecting those sources, applying one set of definitions and showing the result where people will see it.
Typical projects include executive dashboards fed by live data pipelines, field-team mobile apps that log activity in real time, and connected-hardware platforms with threshold alerts. The smart disinfection case study is one example, where live dosing telemetry and automatic alerts replaced fault discovery during site visits days later. You can browse more case studies or see the full list of software development services.
Conclusion
KPI examples are most useful when they are treated as templates, not as a shopping list. The strongest key performance indicators tie one goal to one formula, one target, one data source and one owner. Reviewing them on a fixed schedule lets the trend tell a clear story.
Start with the five core business performance indicators, add three to five measures for each team, and balance every lagging result with a leading signal. Document each one with the KPI format sample or the key performance areas template, then pick a chart that fits what the number needs to show. Revisit the whole set every quarter. When the time comes to automate that reporting, a well-built dashboard turns these indicators from a monthly spreadsheet chore into a live view of how the business is performing.
Frequently Asked Questions About KPIs
What Is a Key Performance Indicator? Examples to Start With
A key performance indicator is a measurable value tied to a specific business goal, such as revenue growth rate, customer retention rate or first contact resolution rate. Anyone searching "what is a key performance indicator example" usually wants exactly that pairing of definition and sample. Each one has a formula, a target and an owner, which separates it from an ordinary metric.
What's a KPI in Simple Terms?
A KPI is the scoreboard number for a goal that matters. For happier customers, the KPI could be Net Promoter Score; for faster delivery, it could be order fulfillment time in hours.
What are examples of KPIs for a small business?
Good KPIs for a small business are monthly revenue, gross profit margin, cash runway, customer acquisition cost and repeat customer rate. Small teams should start with these five and add department measures only once someone has time to act on them.
How many KPIs should a company track?
A company should track 5 to 10 company-level KPIs, with each team owning 3 to 5 of its own. People who search "what is the KPIs list for my team" often want a long menu, yet a shorter list gets reviewed more often and acted on faster.
Is a KPI the same as a metric?
No, a KPI is not the same as a metric. A metric is any number you track, while a KPI is a metric linked to a strategic goal with a target, a deadline and an accountable owner.
What is a good KPI example for an employee?
A good KPI example for an employee is one the person can directly influence, such as a support agent's first contact resolution rate. For a developer, the share of pull requests merged without rework works well. The measure should connect to a team KPI, so individual effort adds up to company results.
How often should KPIs be reviewed?
Operational KPIs should be reviewed weekly, and strategic KPIs monthly or quarterly. Annual reviews are the right time to retire measures that no longer drive decisions and to reset targets for the year ahead.